Business update:
-
Q3/25: revenues EUR 853 m / 19.5 % adj. EBITDA margin (including a positive one-off), above / at the midpoint of guidance
-
Q3/25: realized run-rate savings of approx. EUR 185 m from ‘Re-establish the Base’ (RtB) program
-
Q3/25: FCF (incl. net interest paid) at EUR 43 m
-
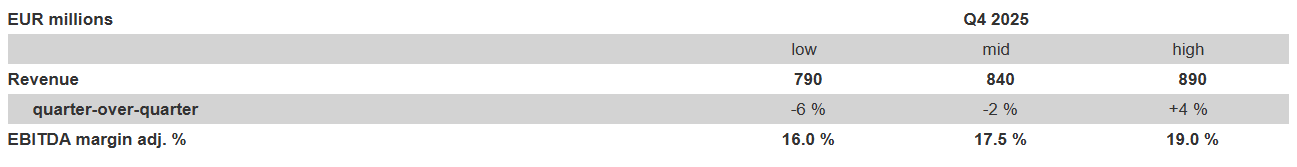
Q4/25: revenue EUR 790 m – 890 m, 17.5 % +/-1.5 % adj. EBITDA, at EUR/USD 1.16 expected
-
FY25: FCF outlook of above EUR 100 m confirmed (assuming timely Chips Act inflows)
-
Design-win momentum on track to reach EUR 5 bn in 2025
Deleveraging plan and refinancing:
-
Process for asset disposals for generating proceeds well above EUR 500 m in 2026 on track
Continuous investment in differentiating technology platforms:
-
Broad patent cross-license agreement signed with Nichia for unparalleled IP safety of customers
-
Advancements in its industry leading infrared LED & infrared laser technology
-
Launched industry benchmark 2-dimensional direct Time-of-Flight sensor platform
“Our core semiconductor business grew again like-for-like in line with our target operating model. As promised, we are delivering a stronger second half in terms of top-line, bottom-line and cash flow, despite the weaker US Dollar and higher raw material prices. At the same time, we are continuously winning new business and are preparing for future growth by launching new technology platforms.” said Aldo Kamper, CEO of ams OSRAM.
Q3/25 business and earnings summary
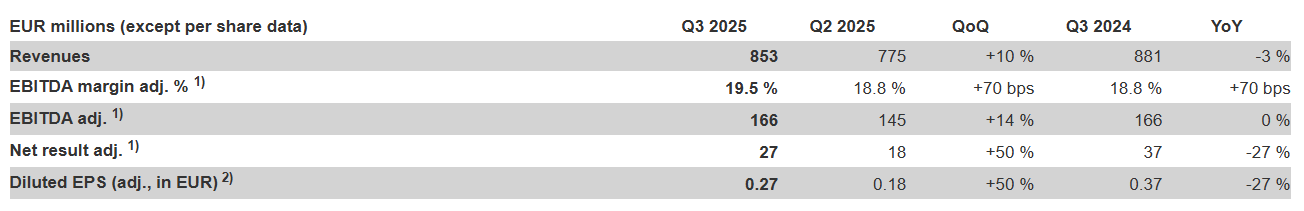
Group revenues came in above the midpoint of the guided range of EUR 790 – 890 million. Reported revenues increased by 10 % quarter-over-quarter due to the typical seasonal automotive-lamps aftermarket upswing and a strong quarter-over-quarter increase in semiconductor revenues. At a constant EUR/USD exchange rate, revenues would have been approx. EUR 20 million higher.
Year-over-year, group revenues declined by 3% mainly driven by the weaker US dollar and the discontinued non-core semiconductor business. Like-for-like, at a constant EUR/USD exchange rate and only considering the core portfolio (incl. L&S), revenues would have been up by approx. 6 % and looking at the semiconductor core portfolio, up by approx. 9 %.
Adj. EBITDA (adjusted earnings before interest, taxes, depreciation, and amortization) came in at the midpoint of the guided range of 19.5 % +/-1.5 %. A profit from the sale of manufacturing assets in the group’s Singapore production site contributed positively.
Adj. net result came in positive at EUR 27 million on the back of improved profitability, including the typical, recurring quarterly adjustments of transformation cost, purchase price allocation and share-based compensation.
Continuous investments in differentiating technology platforms
The company invests both in improving its cost-position by developing cost-performance optimized technology platforms as well as cutting-edge technologies for enabling new markets and new applications. Examples are latest advances in its AlGaAs emitter technology platform for near-infrared applications – the company claims industry leading wall-plug efficiency and output power with a multitude of industrial applications, including automotive, material treatment and defense.
A decisive element in differentiating technology is IP safety for its customers. For this, the company expanded its long-standing collaboration with Nichia in the field of intellectual property (IP) on 16 October 2025 by signing a comprehensive cross-license agreement covering thousands of patent-protected innovations in LED and laser technologies. With the new patent cross-license agreement, both companies offer customers enhanced IP safety when using products based on their patented technologies.
When it comes to optical sensing technologies, the company recently launched an industry leading 2d direct time-of-flight sensing platform that allows for Edge AI sensing, e.g. in smartphones for maintaining focus on moving objects in dynamic video scenes or in logistics robots for distinguishing between nearly identical packages amongst many other potential applications.
Implementation of balance sheet improvement plan
On 30 April 2025, the company announced its accelerated, comprehensive plan to de-leverage its balance sheet. On top of operational improvements driven through its ‘Re-establish the Base’ (RtB) program, this plan also includes assessing the sale of business assets for well above EUR 500 million.
The company is well on track with implementing the RtB program and its efforts on the sale of certain business assets.
Upon completion of the full plan (including a solution for the Kulim-2 Sale-and-Lease back), the plan will reduce the net-debt / adj. EBITDA leverage ratio below 2, minimize the amount to be refinanced, reduce the interest expenses to below EUR 100 million annually and thereby strengthen the operating cash flow further.
Q3/25 Cash generation & balance sheet update
Free cash flow – defined as operating cash flow including net interest paid minus cash flow from CAPEX plus proceeds from divestments – came in positive with EUR 43 million. A year ago, the free cash flow was dominated by a significant customer prepayment of approx. EUR 225 million. Consequently, year-over-year, the underlying free cash flow from normal operations improved significantly.
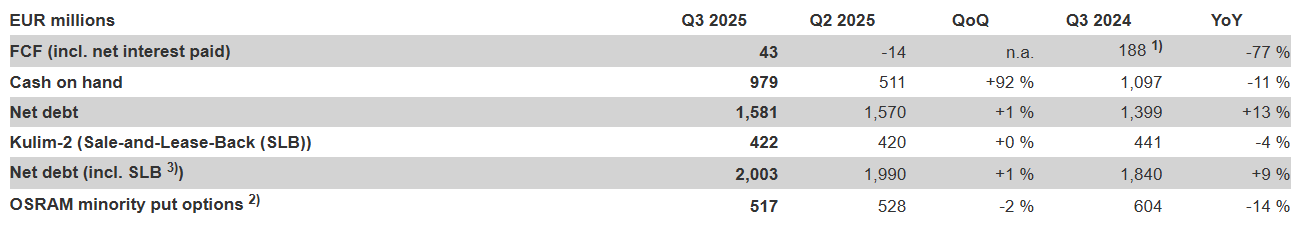
On top, the company continues to expect meaningful cash inflows later in the year from subsidies by the Austrian government under the European Chips Act already notified by the European Commission.
The net debt position slightly increased to EUR 1,581 million quarter-over-quarter after EUR 1,570 million in the previous quarter, mainly due to the quarterly accrued compound interests of the convertible bond. The equivalent value of the Sale-and-Lease Back (SLB) Malaysia transaction increased by EUR 2 million due to a net effect of quarterly accrued interest and MYR exchange rate changes.
The Group held approx. 88 % of OSRAM Licht AG shares at the end of Q3/25. The company has an EUR 800 million Revolving Credit Facility (RCF) in place. The RCF is primarily in place to cover any further significant exercises under the 'domination and profit and loss transfer agreement (DPLTA)’ put option and the undrawn part would be sufficient to fully cover all outstanding minority shareholder’s put options. It can also be drawn for general corporate and working capital purposes.
Q3/25 Business Unit (BU) results & industry update
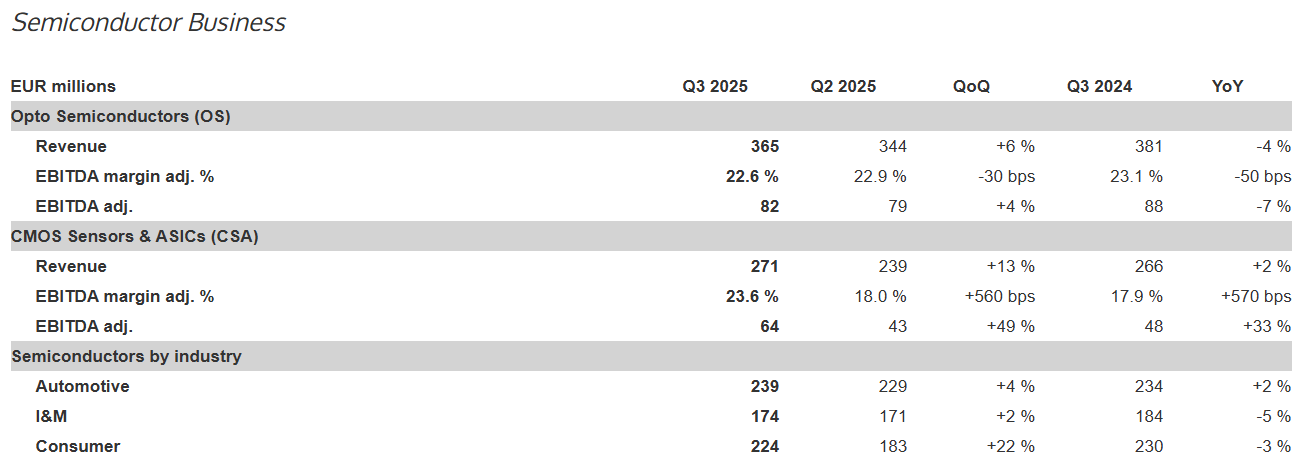
Semiconductor revenues were approx. 75 % of Q3/25 group revenue or EUR 637 million, compared to EUR 647 million a year ago, equally driven by the change in the EUR/USD exchange rate and the phase-out of non-core businesses under the ‘Re-establish the Base’ program, which still contributed with a couple of double-digit million EUR a year ago. Growth in the core portfolio, especially with new sensor products, made up for the divested or discontinued non-core portfolio. The comparable growth in semiconductors was approx. 9%, when correcting for the phased-out non-core portfolio (approx. EUR 30 million) and EUR/USD exchange rate (approx. EUR 30 million) - in line with the mid-term target growth corridor of the semiconductor target operating model.
Optical Semiconductors (OS)
A seasonal upswing in horticulture and slightly increased sales in Automotive led the quarter-over-quarter improvement.
Adj. EBITDA increased to EUR 82 million compared to EUR 79 million in Q2 on the back of gross profit fall through partially off-set by positive one-offs in Q2, such as catch-up of subsidies.
CMOS Sensors & ASICs (CSA):
Revenues steeply increased quarter-over-quarter. Demand for components for consumer handheld devices showed its typical seasonal peak and sales into industrial & medical applications stabilized further.
Adj. EBITDA improved by EUR 21 million in Q3/25 compared to the previous quarter driven primarily by the sale of a manufacturing asset in the company’s Singapore production facilities in the context of the ‘Re-establish the Base’ program (see ‘Other Operating Income’) and gross profit fall-through.
Semiconductors industry dynamics
Automotive:
Business improved quarter-over-quarter on the back of an ended inventory correction in the LED supply chain, but without any meaningful re-stocking in sight. During the quarter, book-to-bill ratio hovered around 1. Year-over-year, auto revenues came in 2 % higher, showing the re-balancing of the inventory levels in the opto-electronic supply chain. Automotive customers continue to order with a very short-term horizon.
Industrial & Medical (I&M):
End-markets stabilized but are still partially muted. Professional lighting business continued to perform well in a competitive market and the horticulture business showed its seasonal peak. Industrial automation improved slightly but remains at a low level. In the mass market, Europe and the Americas showed a relatively better performance than China. In medical, the market stabilized further.
Consumer:
Demand for new products and for consumer portable devices in general showed its seasonal peak. Recently introduced products proliferated to further platforms.
Year-over-year, revenues decreased slightly by 3 %, entirely due to the weaker US dollar. On a comparable basis, the new products more than compensated for the phase-out and revenue decline of discontinued products from the non-core portfolio.
Lamps & Systems Business (traditional auto & industrial lamps)
Lamps & Systems represented approx. 25 % of Q3/25 group revenues. The typical seasonal upswing drove the strong quarter-over-quarter increase, whilst the year-over-year decline can be attributed to the decline in automotive OEM lamps business, as less and less cars are equipped with traditional halogen lamps when they leave the factory.
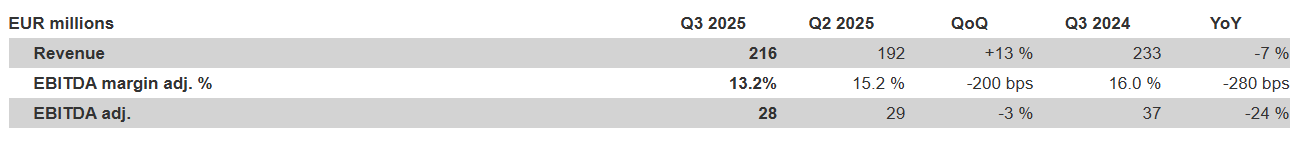
Revenues in Specialty Lamps remained at a typical level and were almost unchanged compared to the previous quarter.
Adj. EBITDA remained essentially unchanged as inventory reductions and typical, seasonally higher marketing expenses in the aftermarket business balanced the fall-through from higher revenues.
Guidance for the fourth quarter 2025
The company expects for its semiconductor business:
Automotive: more or less flat demand in line with the overall market uncertainty seen by OEMs and Tier-1s. Short-term order entry pattern persisting.
Industrial and medical: development in line with a slow market recovery.
Consumer: typical, seasonal revenue reduction after the seasonal peak in Q3.
Combined, the semiconductor business is expected to follow its typical seasonal pattern with a softer fourth quarter. Year-over-year, a slight decline may be seen, if the exited non-core portfolio and a close to mid-double-digit million impact from the weaker US dollar cannot be fully compensated by supply chain normalization in I&M and the revenues from the recently introduced consumer products.
The company expects the seasonal peak in Q4 with strong automotive aftermarket sales for its traditional auto lamps business.
As a result, the Group expects fourth quarter revenues to land in a range of EUR 790 – 890 million assuming a EUR/USD exchange rate of 1.16. The impact of the weaker USD on revenues compared to a year ago is of the order of mid-double digit million Euro.
The company expects adj. EBITDA to come in at 17.5 % +/-1.5 % in line with revenue development and the absence of the one-time profit from the sale of manufacturing assets in its Singapore production facilities in Q3.
 Gold+ Member Report
(Global LED Industry Database vs. LED Player Movement Quarterly Update)
|
Report Title
|
Content
|
Format
|
Publication
|
|
LED Industry Demand
and Supply Database
|
Demand Market Analysis:
|
PDF / Excel
|
1Q (Mid March)
3Q (Early September)
|
|
2025-2029 Demand Market Forecast
|
|
(Backlight and Flash LED / General Lighting / Agricultural Lighting / Architectural Lighting / Automotive- Passenger Car & Box Truck & Scooter / Video Wall / UV LED / IR LED / Micro LED / Mini LED)
|
|
Supply Market Analysis:
|
|
1. LED Chip Market Value (External Sales, Total Sales)
|
|
2. WW New / Accumulated GaN LED and AS/P LED MOCVD Chamber Installations
|
|
3. GaN LED and AS/P LED Wafer Market Demand (By Region / By Wafer Size)
|
|
4. GaN LED and AS/P LED Wafer Market Demand and Supply Analysis
|
|
LED Player Revenue
and Capacity
|
LED Chip Market Analysis:
|
PDF / Excel
|
2Q (Early June)
4Q (Early December)
|
|
Top 10 LED Chip Manufacturers by Revenue and Wafer Capacity
|
|
LED Package Market Analysis:
|
|
LED Package Manufacturers: Total Revenue, LED Revenue, and Capacity Analysis
|
|
Top 10 LED Package Players by Revenues in Backlight and Flash LED, Lighting, Automotive, Video Wall, UV LED
|
|
LED Industry Price Survey
|
Sapphire / Chip / Package (Backlight, General Lighting, Agricultural Lighting, Automotive, Video Wall, UV LED, IR LED, VCSEL)
|
Excel
|
1Q (Mid March)
2Q (Early June)
3Q (Early September)
4Q (Early December)
|
|
LED Industry Quarterly Update
|
Major Players Quarterly Update:
|
PDF
|
1Q (Mid March)
2Q (Early June)
3Q (Early September)
4Q (Early December)
|
|
EU / U.S- Lumileds, ams OSRAM, Cree LED
|
|
JP- Nichia, Stanley, ROHM
|
|
KR- Samsung, Seoul Semiconductor, Seoul Viosys
|
|
ML- Dominant
|
|
TW- Ennostar, Everlight, LITEON, AOT, Harvatek, PlayNitride
|
|
CN- San’an, Changelight, HC SemiTek, Aucksun, Focus Lightings, Nationstar, Hongli, Refond, Jufei, MTC, MLS
|
|
Micro/Mini LED
Exhibit Report
|
CES 2025 / Touch Taiwan 2025
|
PDF
|
Aperiodically
|
If you would like to know more details , please contact:


