New Visual Economic Tool™ offers a comprehensive, economic analysis to properly evaluate multiple lighting systems; provides superior business assessment than typical “payback” methods.
Acuity Brands, Inc. has developed a leap-forward financial tool that allows users to determine the true economic value of a lighting system, greatly exceeding the simple data output found on many industry “payback” calculators. The Visual Economic Tool™ is a free, web-based, user-friendly design tool that uses recommended industry practices to simultaneously estimate and compare the life-cycle costs of up to three lighting systems.
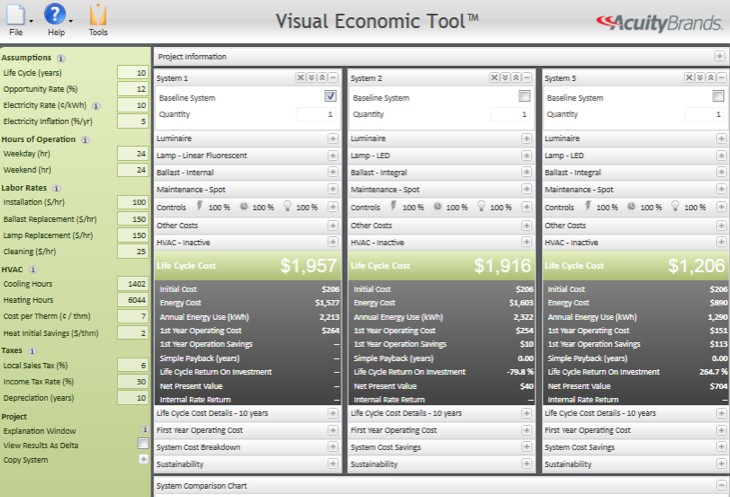
“This is a breakthrough tool that provides users with more data, deeper evaluations and more choices,” said Randall King, Director of Illuminating Engineering Services for Acuity Brands Lighting. “You can choose to perform energy-only estimates or input additional information to create estimates that include maintenance, lighting controls and HVAC data. The resulting calculated costs can include economic return as well as life-cycle costs, net present value, and internal rate of return. These second-level analysis methods provide an owner with a better business assessment than the typical payback methods currently employed because they account for the time value of money and total cost of ownership,” said King.
The Visual Economic Tool is an integral part of the Company’s Visual® lighting design tools and is available as a free resource; no log-in is required. Users can input data from any products within the Acuity Brands interior and exterior lighting product portfolio or even data from non-Acuity Brands lighting products. The tool has the flexibility to compare lighting systems using various lighting controls methods and common light sources, including LED, metal halide and fluorescent.
The Visual Economic Tool calculations are based on the widely accepted IESNA RP-31-1996 “Recommended Practice for the Economic Analysis of Lighting” standards. Data is presented using vivid, easy-to-follow charts. A built-in help feature reviews definitions, displays calculation formulas and links to additional resources. Comprehensive reports can be printed or saved as a PDF format, or easily shared with other users to review and edit data if desired. Luminaire data can be loaded in any of the other Visual design tools, saving user time while promoting data consistency.


